- Published on
🧠 AI Exploration #8: DBSCAN Explained
- Authors

- Name
- Van-Loc Nguyen
- @vanloc1808
🧠 AI Exploration #8: DBSCAN Explained
DBSCAN (Density-Based Spatial Clustering of Applications with Noise) is a powerful clustering algorithm that groups together data points that are close to each other based on density - and separates outliers.
Unlike K-Means, you don't need to specify the number of clusters in advance.
🧠 How DBSCAN Works
DBSCAN relies on two parameters:
eps: The maximum distance between two points to be considered neighborsmin_samples: The minimum number of neighbors needed to form a dense region
It classifies points as:
- Core Point: Has at least
min_sampleswithinepsradius - Border Point: Within
epsof a core point but not a core itself - Noise Point: Not within
epsof any core point
Clusters are formed by expanding core points, while noise points are ignored.
🧮 Mathematical Definition of DBSCAN
Let’s define a few key terms more formally:
1. ε-neighborhood of a point
Given a point and radius ,
This is the set of all points within distance of .
2. Core Point
A point is a core point if:
That is, it has at least minPts neighbors (including itself) in its ε-neighborhood.
3. Direct Density-Reachability
A point is directly density-reachable from a point if:
- is a core point
4. Density-Reachability
A point is density-reachable from if there exists a chain of points:
such that is directly density-reachable from .
5. Density-Connected
Two points and are density-connected if there exists a point such that both and are density-reachable from .
🎯 When to Use DBSCAN
- When clusters have irregular shapes (not spherical)
- When data contains outliers
- When you don’t know how many clusters exist
✅ Advantages and Disadvantages
✅ Pros
- Does not require you to specify number of clusters
- Can detect outliers (label as noise)
- Works well with clusters of arbitrary shape
❌ Cons
- Choosing
epsandmin_samplescan be tricky - Performance degrades in high-dimensional spaces
🧪 Code Example: DBSCAN on Iris Dataset
from sklearn.datasets import load_iris
from sklearn.cluster import DBSCAN
from sklearn.preprocessing import StandardScaler
import matplotlib.pyplot as plt
import seaborn as sns
import pandas as pd

# Load dataset
iris = load_iris()
X = iris.data
features = iris.feature_names

# Standardize features (important for distance-based models)
X_scaled = StandardScaler().fit_transform(X)

# Run DBSCAN
dbscan = DBSCAN(eps=0.6, min_samples=4)
clusters = dbscan.fit_predict(X_scaled)

# Visualize
df = pd.DataFrame(X, columns=features)
df['Cluster'] = clusters

sns.pairplot(df, hue='Cluster', palette='Set1', corner=True)
plt.suptitle('DBSCAN Clustering on Iris Dataset', y=1.02)
plt.tight_layout()
plt.show()
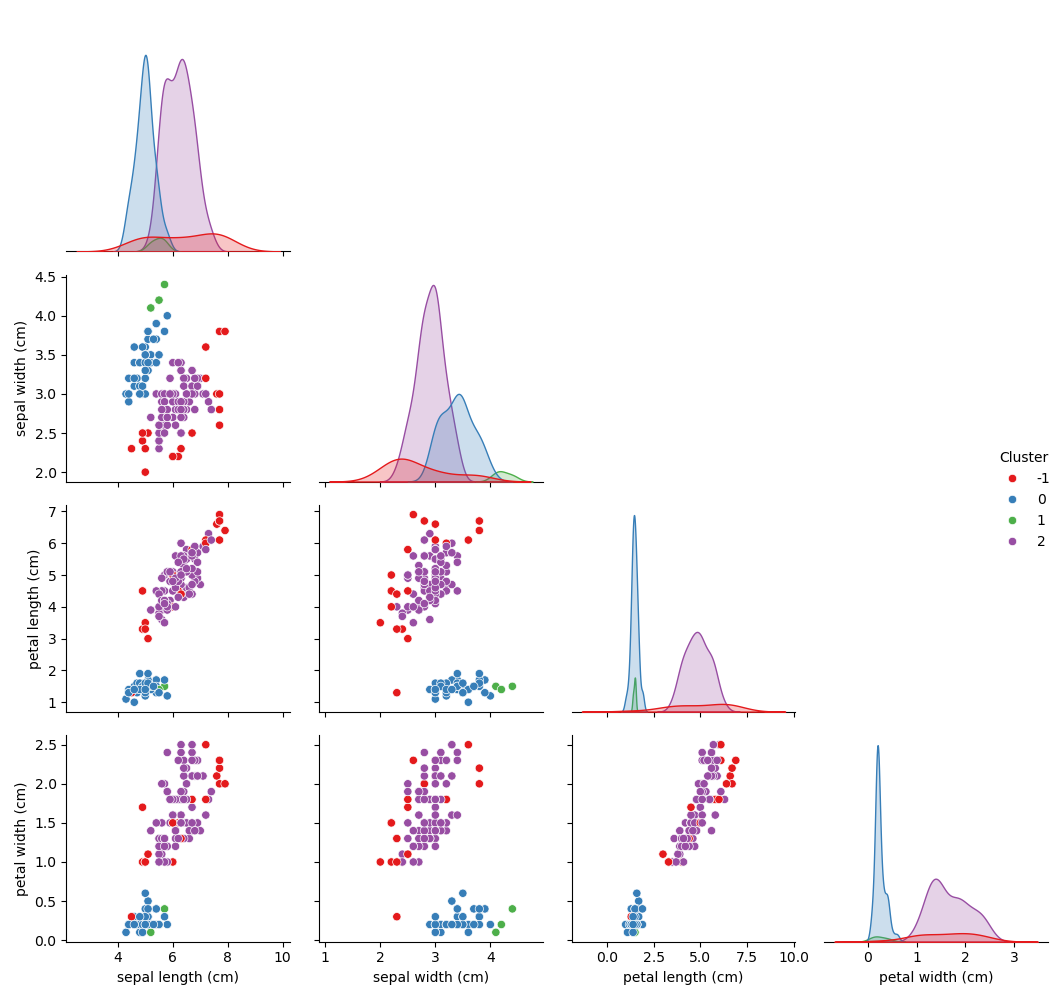
This example uses DBSCAN to automatically find structure in the Iris dataset - no cluster count needed.
📊 The plot below reveals how DBSCAN discovered three dense clusters and labeled several outlier points as noise (in red, cluster -1). Unlike K-Means, DBSCAN effectively identifies non-spherical structures and isolates sparse, scattered points - showcasing its strength in handling real-world imperfections.
🔍 K-Means vs. DBSCAN Comparison
K-Means (previous post) cleanly splits the Iris dataset into three compact, spherical clusters, assuming equal density and ignoring outliers.
DBSCAN (this post), in contrast, is density-aware - it detects clusters of varying shapes and automatically flags outliers (in red, cluster
-1). This makes DBSCAN more suitable for datasets with noise or uneven cluster sizes, whereas K-Means may struggle when clusters are non-convex or imbalanced.
📊 Notes on Parameter Tuning
- Use k-distance plot to find a good value for
eps - Set
min_samplesroughly equal to the number of features or slightly larger
🔚 Recap
DBSCAN is ideal for clustering spatial, noisy, or arbitrarily shaped data without predefining the number of clusters. Its ability to handle noise makes it a go-to algorithm for real-world exploratory clustering tasks.
🔜 Coming Next
Next in this subseries of clustering techniques: Hierarchical Clustering - where we build a tree of nested clusters and cut it at the desired level.
Stay curious and keep exploring 👇