- Published on
🧠 AI Exploration #7: K-Means Clustering Explained
- Authors

- Name
- Van-Loc Nguyen
- @vanloc1808
🧠 AI Exploration #7: K-Means Clustering Explained
K-Means is one of the most widely used algorithms for unsupervised clustering. It partitions data into K distinct groups based on similarity, without requiring any labels.
In this post, you’ll learn what K-Means is, how it works, the math behind it, how to choose K, and how to implement it in Python.
🧩 What is K-Means?
K-Means Clustering aims to group data points into K clusters such that each point belongs to the cluster with the nearest mean (centroid).
🧠 How K-Means Works (Step-by-Step)
- Initialize K centroids randomly
- Assign each point to the nearest centroid
- Update centroids by computing the mean of points in each cluster
- Repeat steps 2–3 until convergence (assignments don’t change)
The objective is to minimize the intra-cluster variance (or within-cluster sum of squares).
🧮 Objective Function
The K-Means algorithm minimizes the following loss:
Where:
- is the set of points in cluster
- is the centroid of cluster
📉 Choosing K: The Elbow Method
The number of clusters is a hyperparameter.
To choose , you can:
- Plot inertia (sum of squared distances to nearest centroid)
- Look for an “elbow” point where the gain of adding more clusters drops off
The image below shows the "elbow point" where the gain of adding more clusters drops off.
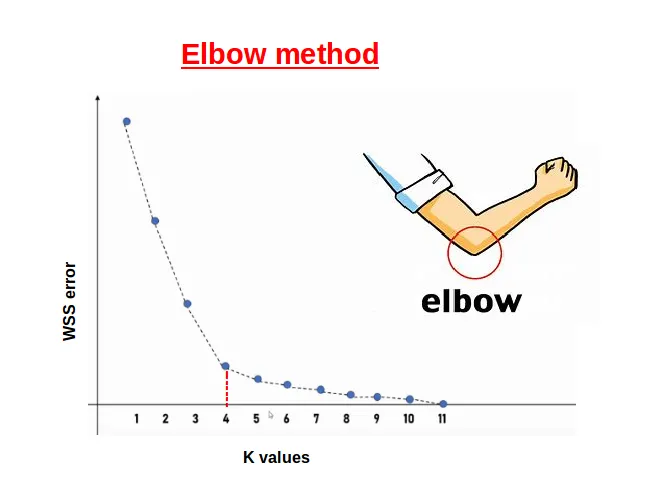
Figure: Elbow point where the gain of adding more clusters drops off. Source:
Medium
🧪 Code Example: Clustering Iris Data with K-Means
from sklearn.datasets import load_iris
from sklearn.cluster import KMeans
import matplotlib.pyplot as plt
import seaborn as sns
import pandas as pd

# 📥 Load Iris data
iris = load_iris()
X = iris.data
labels = iris.target
features = iris.feature_names

# 🔍 Apply KMeans clustering
kmeans = KMeans(n_clusters=3, random_state=42)
clusters = kmeans.fit_predict(X)

# 📊 Visualize clusters
df = pd.DataFrame(X, columns=features)
df['Cluster'] = clusters

sns.pairplot(df, hue='Cluster', palette='Set2', corner=True)
plt.suptitle('K-Means Clustering on Iris Dataset', y=1.02)
plt.tight_layout()
plt.show()
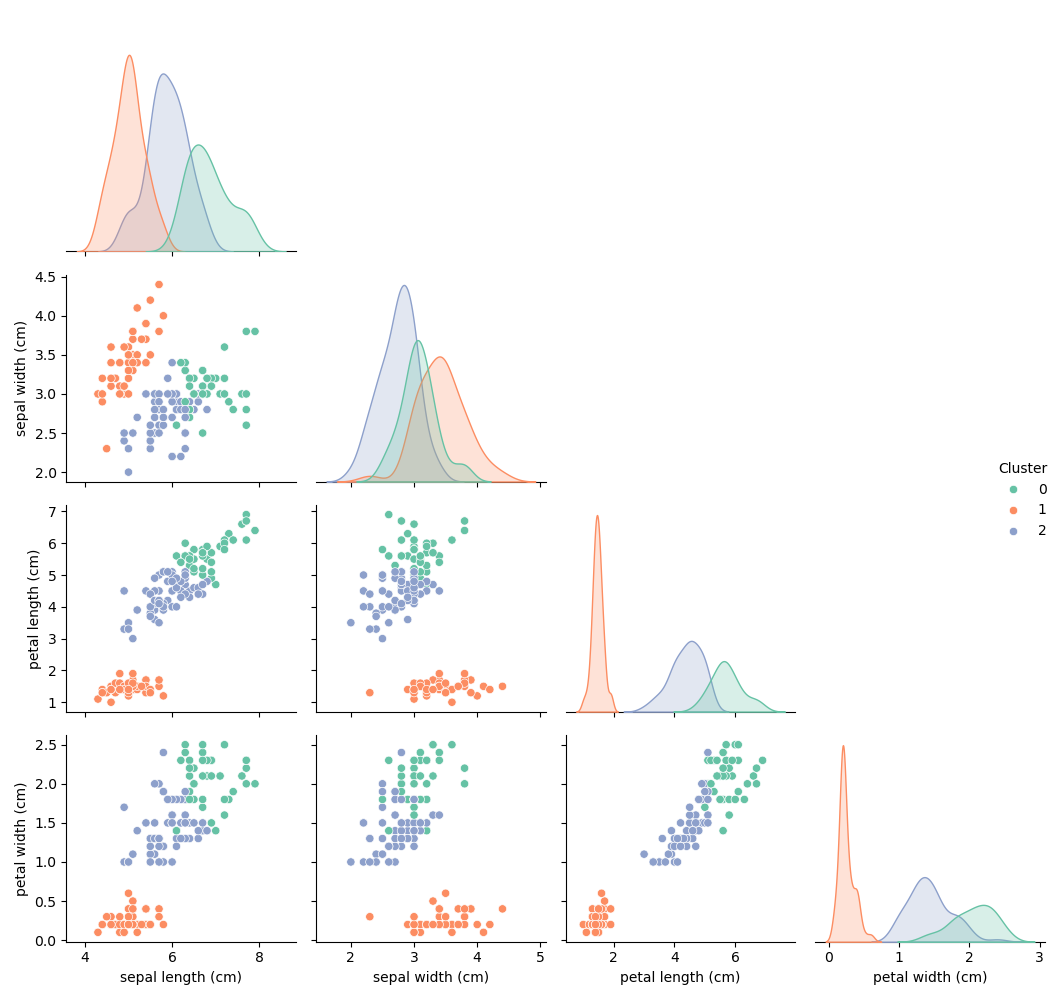
This example clusters the Iris dataset into 3 groups without using the true species labels - demonstrating the power of unsupervised learning to discover structure.
📊 The pair plot below shows how K-Means clustered the Iris dataset into three distinct groups based on feature similarities - without using the true species labels. Notably, the clusters align well with actual species, especially when petal length and petal width are involved, demonstrating the power of unsupervised learning in discovering natural structure.
📈 Along the diagonal, each subplot is a KDE (Kernel Density Estimate) plot, which visualizes how values of a specific feature are distributed within each cluster:
- Each colored curve represents one cluster (e.g., Cluster 0, 1, or 2).
- The x-axis is the feature value (e.g., petal width), while the y-axis is the estimated density.
- Peaks in the KDE plots show where data points concentrate - helping you see which features best separate the clusters.
- If the KDE curves are clearly separated, the feature contributes strongly to the clustering.
✅ Pros and Cons
✅ Advantages
- Simple, fast, and easy to implement
- Works well when clusters are spherical and well-separated
- Scales to large datasets
❌ Disadvantages
- Must specify K in advance
- Sensitive to initialization (can converge to local minima)
- Struggles with irregular or non-spherical cluster shapes
📊 When to Use K-Means
Use K-Means when:
- You want fast, scalable clustering
- You have a rough idea of how many clusters exist
- Your data has relatively uniform variance
🔚 Recap
K-Means is a go-to algorithm for many clustering problems. While simple, it’s powerful when applied to the right kind of data and offers a great starting point for unsupervised learning tasks.
🔜 Coming Next
Next in this subseries of clustering techniques: DBSCAN - a density-based method for discovering clusters of arbitrary shape and detecting outliers.
Stay curious and keep exploring 👇
🙏 Acknowledgments
Special thanks to ChatGPT for enhancing this post with suggestions, formatting, and emojis.