- Published on
🧠 AI Exploration #6: Unsupervised Learning Explained
- Authors

- Name
- Van-Loc Nguyen
- @vanloc1808
🧠 AI Exploration #6: Unsupervised Learning Explained
Unlike supervised learning, unsupervised learning doesn't rely on labeled data. Instead, it uncovers hidden patterns and structures in input data - making it ideal for exploration, compression, and understanding unknown datasets.
In this post, we’ll explore the core concepts of unsupervised learning, major techniques, real-world applications, and an illustrative Python example.
🧭 What is Unsupervised Learning?
In unsupervised learning, the model is given input data without any labels and must discover:
- Clusters or groups of similar samples
- Underlying structures or patterns
- Lower-dimensional representations of data
You don’t tell the model what to predict - you let it find structure on its own.
🔍 Real-Life Example: Customer Segmentation
Imagine you're analyzing customer behavior on an e-commerce site:
- Input: Purchase history, page views, demographics
- No labels.
- Goal: Group customers into clusters like “bargain hunters”, “loyal buyers”, or “window shoppers”
Unsupervised learning helps segment users for targeted marketing, without prior knowledge of their category.
🧠 Common Unsupervised Techniques
| Technique | Description | Example Use Case |
|---|---|---|
| Clustering | Groups data into distinct clusters | Customer segmentation, anomaly detection |
| Dimensionality Reduction | Compresses features while preserving structure | Data visualization, noise reduction |
| Association Rules | Finds patterns in transactions | Market basket analysis (e.g., "users who buy X also buy Y") |
🧪 Popular Algorithms
| Algorithm | Type | Description |
|---|---|---|
| K-Means | Clustering | Assigns points to K clusters based on similarity |
| DBSCAN | Clustering | Groups data by density; good for irregular shapes |
| Hierarchical Clustering | Clustering | Builds a tree of nested clusters |
| PCA | Dimensionality Reduction | Projects data to principal axes for visualization |
| t-SNE / UMAP | Dimensionality Reduction | Preserves local structure for visualization |
| Apriori / FP-Growth | Association Rules | Mines frequent itemsets and rules in transactions |
📊 Evaluation (without Labels?)
Even without labels, we can still evaluate unsupervised models:
| Metric | Use Case |
|---|---|
| Silhouette Score | Clustering compactness and separation |
| Inertia (K-Means) | Within-cluster sum of squares |
| Reconstruction Error | For dimensionality reduction and autoencoders |
🧪 Code Example: Clustering Iris Data with K-Means
from sklearn.datasets import load_iris
from sklearn.cluster import KMeans
import matplotlib.pyplot as plt
import seaborn as sns
import pandas as pd

# 📥 Load Iris data
iris = load_iris()
X = iris.data
labels = iris.target
features = iris.feature_names

# 🔍 Apply KMeans clustering
kmeans = KMeans(n_clusters=3, random_state=42)
clusters = kmeans.fit_predict(X)

# 📊 Visualize clusters
df = pd.DataFrame(X, columns=features)
df['Cluster'] = clusters

sns.pairplot(df, hue='Cluster', palette='Set2', corner=True)
plt.suptitle('K-Means Clustering on Iris Dataset', y=1.02)
plt.tight_layout()
plt.show()
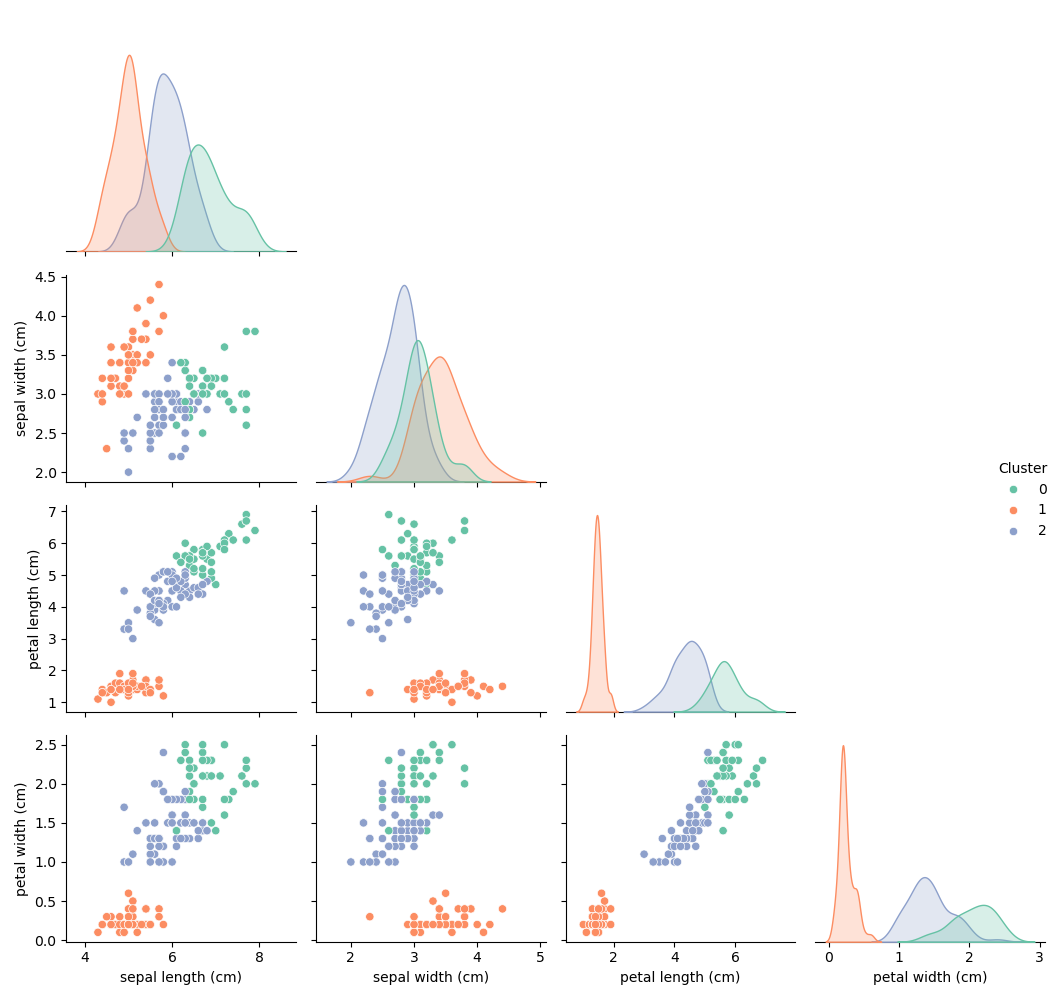
This example clusters the Iris dataset into 3 groups without using the true species labels - demonstrating the power of unsupervised learning to discover structure.
📊 The pair plot below shows how K-Means clustered the Iris dataset into three distinct groups based on feature similarities - without using the true species labels. Notably, the clusters align well with actual species, especially when petal length and petal width are involved, demonstrating the power of unsupervised learning in discovering natural structure.
📈 Along the diagonal, each subplot is a KDE (Kernel Density Estimate) plot, which visualizes how values of a specific feature are distributed within each cluster:
- Each colored curve represents one cluster (e.g., Cluster 0, 1, or 2).
- The x-axis is the feature value (e.g., petal width), while the y-axis is the estimated density.
- Peaks in the KDE plots show where data points concentrate - helping you see which features best separate the clusters.
- If the KDE curves are clearly separated, the feature contributes strongly to the clustering.
✅ When to Use Unsupervised Learning
- When you have unlabeled data
- When you want to explore or visualize your dataset
- When you’re building recommender systems, anomaly detectors, or market segmentation tools
🔚 Recap
Unsupervised learning unlocks the power of pattern discovery in raw, unlabeled data. From clustering to dimensionality reduction, it forms the backbone of many exploratory data science workflows.
🔜 Coming Next
In the next post, we’ll explore Semi-Supervised Learning - where a small amount of labeled data guides learning on a large pool of unlabeled data.
Stay curious and keep exploring 👇
🙏 Acknowledgments
Special thanks to ChatGPT for enhancing this post with suggestions, formatting, and emojis.