- Published on
🧠 AI Exploration #5: Classification in Supervised Learning
- Authors

- Name
- Van-Loc Nguyen
- @vanloc1808
🧠 AI Exploration #5: Classification in Supervised Learning
Classification is a key branch of supervised learning focused on predicting categories or class labels. Whether you're building a spam detector or a disease classifier, classification is everywhere.
In this post, we'll explore how classification works, common algorithms, loss functions, evaluation metrics, and a practical code example.
🧠 What is Classification?
Classification is a supervised learning task where the goal is to assign inputs to one of several discrete categories.
In contrast to regression (which predicts continuous values), classification outputs labels like
spam/not spam,cat/dog, orpositive/negative.
📦 Real-Life Example: Email Spam Detection
- Input (X): Email text content, sender, subject line
- Output (Y): Label (
SpamorNot Spam) - The model learns from thousands of labeled emails to identify spam patterns.
🧪 Types of Classification
| Type | Description | Examples |
|---|---|---|
| Binary Classification | Two possible classes | Spam detection, tumor: benign/malignant |
| Multiclass Classification | More than two classes | Digit recognition (0–9), animal type |
| Multilabel Classification | Assign multiple labels to one instance | Tagging articles with multiple topics |
🔑 Common Algorithms
| Algorithm | Description | Best For |
|---|---|---|
| Logistic Regression | Linear classifier for binary/multiclass | Text, tabular data |
| Decision Tree | Tree-based splits on features | Interpretable models |
| Random Forest | Ensemble of trees | Robust multiclass tasks |
| Naive Bayes | Probabilistic model | Spam filtering, sentiment analysis |
| k-NN | Classifies based on nearest neighbors | Small datasets |
| SVM | Finds optimal margin between classes | High-dimensional data |
| Neural Networks | Deep models for complex data | Image, audio, text |
📉 Loss Functions
🔹 Cross-Entropy Loss (Log Loss)
For binary classification:
For multiclass:
This penalizes confident but incorrect predictions more heavily.
📊 Evaluation Metrics
| Metric | Use Case | Notes |
|---|---|---|
| Accuracy | Overall correctness | Good for balanced datasets |
| Precision | Of predicted positives, how many are correct | Important for reducing false positives |
| Recall | Of actual positives, how many are found | Important for catching all positives |
| F1 Score | Harmonic mean of precision and recall | Best when classes are imbalanced |
| Confusion Matrix | Detailed view of TP, FP, FN, TN | Great for multi-class diagnostics |
🧪 Code Example: Classifying Iris Species
We’ll use the classic Iris dataset to classify flower species using LogisticRegression.
import matplotlib.pyplot as plt
import seaborn as sns
from sklearn.datasets import load_iris
from sklearn.linear_model import LogisticRegression
from sklearn.model_selection import train_test_split
from sklearn.metrics import classification_report, confusion_matrix
# 🌸 Load the Iris dataset
data = load_iris()
X = data.data
y = data.target
class_names = data.target_names
# 🔀 Train-test split
X_train, X_test, y_train, y_test = train_test_split(
X, y, test_size=0.2, random_state=42
)
# 🧠 Train a classifier
model = LogisticRegression(max_iter=200)
model.fit(X_train, y_train)
# 📈 Make predictions
y_pred = model.predict(X_test)
# 📊 Evaluate
print(confusion_matrix(y_test, y_pred))
print(classification_report(y_test, y_pred))
# 🖼️ Save confusion matrix plot
cm = confusion_matrix(y_test, y_pred)
plt.figure(figsize=(6, 5))
sns.heatmap(
cm,
annot=True,
fmt="d",
cmap="Blues",
xticklabels=class_names,
yticklabels=class_names,
)
plt.xlabel("Predicted")
plt.ylabel("Actual")
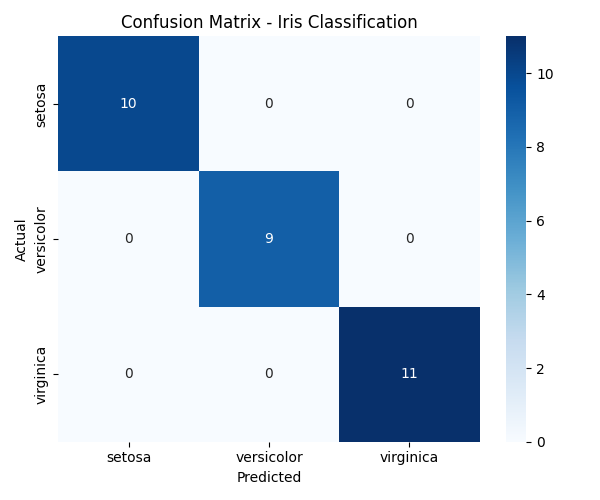
plt.title("Confusion Matrix - Iris Classification")
plt.tight_layout()
plt.savefig("iris_confusion_matrix.png")
📊 The confusion matrix below (achieved after running the code) shows that the model classified all test samples correctly across all three classes (
setosa,versicolor,virginica). This indicates excellent performance on the Iris dataset, with no misclassifications.
This example shows how simple it is to train a multiclass classifier and measure precision, recall, and F1-score.
✅ When to Use Classification
- When your output is a class label
- When you're solving problems like diagnosis, fraud detection, tagging, or recognition
- When accuracy, precision, or recall is more meaningful than raw numeric error
🔚 Recap
Classification is essential for teaching machines how to recognize and label the world. With the right models and evaluation metrics, it powers countless applications - from medical screening to language processing.
🔜 Coming Next
In the next post, we’ll explore Unsupervised Learning - where models learn from unlabeled data to find hidden structures.
Stay curious and keep exploring 👇
🙏 Acknowledgments
Special thanks to ChatGPT for enhancing this post with suggestions, formatting, and emojis.